After reading a recent post by Steve Souders concerning a free tool called dynaTrace Ajax, I was intrigued. It claimed to provide full tracing analysis of Internet Explorer 6-8 (including JavaScript, rendering, and network traffic). Giving it a try I was very impressed. I tested against a few web sites but got the most interesting results running against the JavaScript-heavy Gmail in Internet Explorer 8.
I typically don’t write about most performance analysis tools because, frankly, most of them are quite bland and don’t provide very interesting information or analysis. dynaTrace provides some information that I’ve never seen before – in any tool on any browser.
dynaTrace Ajax works by sticking low-level instrumentation into Internet Explorer when it launches, capturing any activity that occurs – and I mean virtually any activity that you can imagine. I noticed very little slow down when running the browser in tracing mode (although it’s sometimes hard to tell, considering the browser). However all of the tracing is recorded and saved for later, making it easy to record sessions for later analysis.
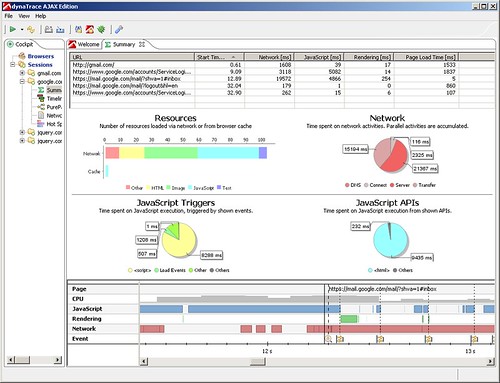
Above is the result of a recorded session, logging in to Gmail, reading a mail, and logging back out again. All aspects of the session are saved: Network requests, JavaScript source, all DOM events, etc. I had a hard time finding information that wasn’t saved by the tool.
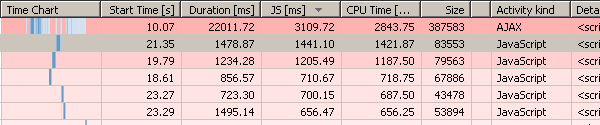
This is the full timeline view of loading a single the Gmail inbox. All network traffic, JavaScript parsing and execution, browser events, and CPU load can be seen.
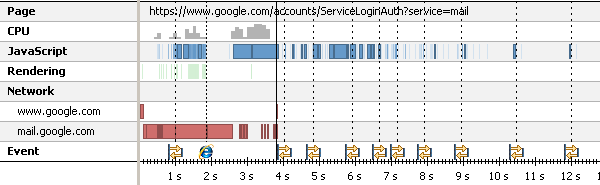
You can select a segment of the timeline and get a view that looks like the following:
In the above you can see a clearer picture of the exact interactions happening. A phenomenal amount of inline JavaScript execution followed by page layout calculation coinciding with loading of some data over the network. You can mouse over the individual blocks on the timeline to get more information (such as if the JavaScript execute was the result of a timer or what Ajax requests were firing to cause the network traffic). Additionally you can click the blocks to dive in and take a deeper view of the trace.
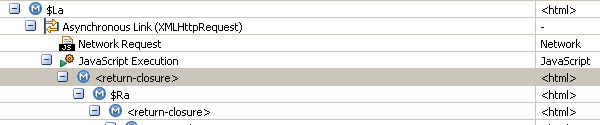
Digging in to the execution of an XMLHttpRequest on a page we get to see some of the full execution stack trace – and this is where the tools starts to become really interesting. The tool is capable of tracing across JavaScript, through the native XMLHttpRequest, through the network request, and back to the handler that fires when the request is done. This is phenomenal. This is the first tool that I’ve seen that’s capable of tracing through native methods to give you a picture of what activity triggers which actions and the complete ramifications of what happens (in both CPU usage and execution time).
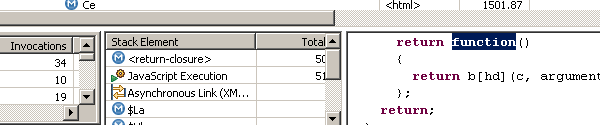
Note that in the stack trace view you can click any piece of code and see its location anywhere inside the source code (and this even works after you’ve already closed the browser and have moved on – all source code is saved for later analysis).
While it’s interesting to trace through code to look for problems the bigger question is usually: Where are slowdowns occurring? This is where the HotPath view comes into play:
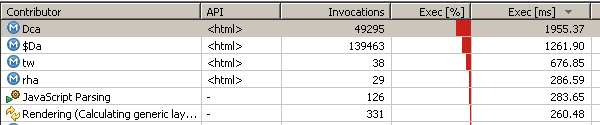
This looks like a typical execution count view – like the one that you might see in Internet Explorer’s built in tool or in Firebug – except for one important point: This view includes JavaScript parsing and layout rendering times. This is huge! No other tool provides information on how long it takes to parse all the JavaScript code on your site or how long it takes to do all the rendering. Clicking those entries allows you to see a breakdown of every time JavaScript was parsed or a layout was rendered – from which you can trace back to get even more information about what caused those actions. I don’t want to seem too excited but I really am, this is just an incredible amount of information – and it gets even better:
Not only can you see the execution count for your defined JavaScript methods but you can also see execution time for the built-in DOM methods! Wondering what native method calls are slowing down your application? Wonder no more. From the HotSpot view you can filter by DOM or regular JavaScript and see exactly where execution time is going and what methods are so slow.
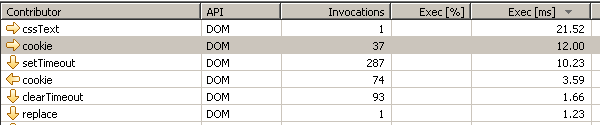
dynaTrace provides an additional view, called PurePath that attempts to figure out problematic scripts:
Just another way to try and get a full picture as to where your application is slowing down and what may be causing the problem.
In all I’m hugely impressed with this (free!) tool and am already using it to do more testing and performance analysis on my code. I don’t think any browser has ever had a tool capable of this type of analysis, let alone Internet Explorer 6 and 7, which are still a very real part of any developer’s workflow.
I chatted with some of the dynaTrace guys and asked them to add in memory profiling and to support more browsers. If they can provide this quality of instrumentation for CPU and execution time I hope they can do the same for memory usage, the next un-tapped realm of JavaScript performance analysis.


Jonathan (November 17, 2009 at 6:37 pm)
Whoa, that is powerful. Do you think Firebug may incorporate some of these ideas someday?
Gilles Cochez (November 17, 2009 at 6:39 pm)
This tool sure look good, if it goes and support all the major browsers we will finally have one tool that does it all. Changing tools when changing browser can be quite frustrating and time consuming (different interface to learn)
Going to give it a go now, thanks for the introduction to it.
Gilles.
olivvv (November 17, 2009 at 6:43 pm)
“Javascript Memory Validator” does memory profiling. http://www.softwareverify.com/javascript/memory/feature.html
(but not for IE, yet) (and its not free).
Sebastian Werner (November 17, 2009 at 6:49 pm)
Great summary John. Read about this a few weeks ago already but your article clearly highlights why it’s worth to get into that tool. Especially as IE is the slowest browser on the market. Optimizing for it might help others, but it really helps IE. And that is what’s important.
jn (November 17, 2009 at 6:53 pm)
it would be interesting to see if there is any memory effect from using tools like YUI compressor or the closure compiler.
Will Morgan (November 17, 2009 at 7:06 pm)
After reading this post, never before have I yearned so much to get into work early, download this tool and start profiling my JavaScript application. Really nice find, John.
Allen Pike (November 17, 2009 at 7:42 pm)
As Javascript apps get richer and heavier, and mobile development becomes more important, good Javascript memory analysis tools are truly needed. Would make a worthy Google Summer of Code project, possibly.
Andreas Grabner (November 17, 2009 at 8:26 pm)
Thanks from the dynaTrace Team about this nice post and for pointing out the problem areas that we address with this tool.
There is a nice Step-By-Step Guide on our blog – http://blog.dynatrace.com/2009/11/17/a-step-by-step-guide-to-dynatrace-ajax-edition-available-today-for-public-download/ – for those that are interesting in getting an easy start with the tool.
cheers
Adam Hahn (November 17, 2009 at 8:39 pm)
I believe Webkit Nightlies and Google Chrome Dev builds now have painting and JS parsing times in the Timeline tab of the Inspector: http://googlewebtoolkit.blogspot.com/2009/11/new-insights-into-web-application.html
Can Berkol (November 18, 2009 at 5:20 am)
I didn’t know about this. Great share, thanks!
Outsider (November 18, 2009 at 6:40 am)
I’m really impressed. it’s wonderful.
Thanks for your recommand.
Daan Mortier (November 18, 2009 at 6:43 am)
This is absolutely exciting. Thanks for sharing, and thanks to the team for all the hard work!
Sachin (November 18, 2009 at 7:53 am)
thanks for sharing..seems very useful.
Ryan Leach (November 18, 2009 at 9:38 am)
Awesome. Another little piece that would add to the joy and the all-in-oneness would be css analysis. Throw in the functionality of CSSUsage and/or dustMe selectors, and then you’ve really got a full picture with all the tools you’d need to keep even the largest app’s codebase wrangled.
Kuroki Kaze (November 18, 2009 at 10:40 am)
Amazing tool. Gotta check some scripts :)
Jonathan Fingland (November 18, 2009 at 11:53 am)
Excellent looking tool. The level of detail provided is simply astounding. Should make identifying the sources of delays a lot easier. Thanks for pointing it out.
I do have to agree with Jonathan (November 17, 2009 at 6:37 pm) that it would be fantastic to see this level of detail in Firebug, though even better would be a consistent cross-browser solution. e.g. one program that can hook into more than one browser.
Steve Souders (November 18, 2009 at 1:24 pm)
Glad I was able to help point the way to this tool. I’ll also shine some light on MSFast (http://msfast.myspace.com/) which does memory profiling (but doesn’t have all this awesome JS debugging!).
Great job on the part of dynaTrace!
Nosredna (November 18, 2009 at 1:35 pm)
I’m curious. Aside from its obviously great perf features, can this also be used to hunt down bugs in IE scripts?
Markus Gaisbauer (November 18, 2009 at 2:26 pm)
Thanks for all the nice words. I am glad that you like what we built and that hours of debugging IE assembly code finally pay off ;-)
Supporting additional browsers in our tool is of course very desirable. Given the large amount of time it requires to build a good and fast UI for analyzing the collected data, it is less than optimal that every browser has to build their own profiler from scratch. As of today, I think that all major browsers (including IE) are lacking appropriate APIs for building a powerful tool like dynaTrace AE without lots of low-level engineering. I am however confident that browser vendors already see the benefit of powerful performance testing tools and that they will help us out with new APIs in order to add better support for their browser in dynaTrace AE.
Memory profiling will definitely soon become more important, especially with the introduction of client side storage in HTML 5. I am curious, where are the major pain points right now? Memory leaks? Max. memory usage and finding out the memory content at a given time (heap dumps)? GC pauses?
We are always eager to get feedback. Don’t hesitate to directly contact us if you found some problem in the current release or if you have concrete ideas on how to make the next release even more useful for building fast web UIs.
Jon Rimmer (November 19, 2009 at 8:49 pm)
My word, this looks absolutely amazing. I can’t wait to try this out in work tomorrow. Kudos dynaTrace!
book (November 21, 2009 at 11:57 am)
Hey John, could you update us with the status of your book?
rajakvk (November 22, 2009 at 3:15 pm)
Thanks for sharing John. Until we kill IE6, any tools of this kind is helpful for sure.
Peter Korba (November 26, 2009 at 10:47 am)
This tool seems to be special – normally these tools only work on the surface and not really go that deep. Great work and thanks for this information.
yangg (November 27, 2009 at 3:44 am)
very good!!
TL (November 28, 2009 at 10:53 am)
Thanks for sharing very useful.
Joey (November 30, 2009 at 10:07 pm)
Thanks to Adam Hanh and to Google. This is why i love webkit so much for developping : the webinspector is sooo damn cool and it gets better every day or so ! Unfortunately, there are three browsers that really count so we need a synthetic tool for all the browsers to get sure that optimizing for one doesn’t have counter effects for the others. Plus, an online tool would be better beczuse i don’t have IE anymore. Yeah i know, but you can make serious development and don’t care about IE in some cases… And yep, it’s like living in paradise :-)
EastFilters (December 7, 2009 at 6:29 am)
http://www.eastfilters.com
Auto Filters, Replacement Elements For Fuel Filters, Turbine Fuel Filters, Replacement for Fuel Filters, Air Filters, Filter Water Separators, Fuel Purification Systems, Engine Fuel Filters, Gasoline Engine Fuel Filter, Diesel Engine Fuel Filter, Trailer Engine Fuel filter, Engine Fuel filter, Car Filter, auto fuel filters, Truck Fuel Filter and Motor Yacht parts.
simaopig (December 16, 2009 at 2:35 am)
It’s so cool thank you.
Mindon (December 30, 2009 at 11:11 am)
I’ve tried google speed tracer before knowing this good news.
It seems supports for firefox is coming up. :)
metallkat (February 3, 2010 at 5:38 pm)
Very great this looks awesome, respect.
Sunil (February 19, 2010 at 4:48 am)
For Markus Gaisbauer
IMO the major pain point as far as Memory Usage in the Browser is concerned, is to identify the major consumers of memory in a given page. Modern day pages do a lot of fancy stuff, very often involving a lot of data. Such pages will invariably consume a lot of browser memory but this is not due to leaks, it’s just inefficient programming. And its not easy to find these memory hoggers and resolve them. A memory profiling tool, especially for Internet Explorer will be just awesome.
Bremer (February 20, 2010 at 11:04 am)
Powerful Toll. I am so interstet in the Firebug Informations.
Yoav Aharoni (February 21, 2010 at 8:31 am)
For those of you interested with firefox/firebug – check out Google Page Speed…
IE Web Admin (March 30, 2010 at 5:03 am)
This is very cool indeed. I am stuck with Companion.js at the moment when I test in IE6 and 7.
John salcome (April 12, 2010 at 7:32 am)
Cool tool, very indepth and complex
Slim (April 21, 2010 at 12:15 pm)
nice tool, very useful, thank a lot!
joboe (April 28, 2010 at 5:20 am)
Hey John,
thanks for the great program! The deep tracking works fine!
SEO (May 5, 2010 at 11:23 pm)
I think it is not easy to find these memory hoggers and resolve them.Thanks.
seo (May 19, 2010 at 1:14 pm)
I’m curious. Aside from its obviously great perf features, can this also be used to hunt down bugs in IE scripts?
Shopmarker (May 31, 2010 at 5:43 pm)
Very cool tool, thanks for sharing.
sk (June 17, 2010 at 2:08 am)
this tool is very cool and provide in depth analysis, im still in the learning process using this tool as im still arent really sure of some parameter which been shown.
really great stuff, keep up the good work
SMS ohne Anmeldung (June 28, 2010 at 1:45 pm)
thanks for the sharing..
Pete (July 6, 2010 at 5:03 pm)
thx for this… i love it!
LaminatCaroline (July 9, 2010 at 3:22 pm)
Thanks a lot! I like!
nlux (July 12, 2010 at 12:38 pm)
Thanks for the valuable information related to dynaTrace Ajax. I didn’t know about it. Its really a great tool that provides all the essential information of a website. Awaiting for your next informative post.
Deal Peter (July 17, 2010 at 5:26 pm)
thanks! i like it beacause it is so simple!
GyuSeong, Gyeong (July 19, 2010 at 4:50 am)
Good combination with YSlow!
I wish..
Not only Trident(IE6,7,8) but also Gecko(FF)..
Welsangeln (July 23, 2010 at 2:37 pm)
Great tool, very nice. Thnaks for sharing
Viraj (August 19, 2010 at 7:10 am)
Very nice tool having lot of functionalities,analysing capabilities. I like !
Magdalena (August 29, 2010 at 3:54 pm)
This is a great analytics tool! I like it. Thanks for sharing.
Juergen (September 5, 2010 at 10:42 am)
Großartiges Analysetool, ist auch in der Schweiz sehr beliebt.
Greetings from Switzerland
Franz (September 7, 2010 at 8:16 am)
Thanks for sharing very useful.
Don (September 10, 2010 at 11:00 pm)
Nice article, thanks!
SEO Master (September 13, 2010 at 7:35 am)
Very nice article – thanks a lot!
Ballettschule (September 22, 2010 at 3:12 pm)
many thanks for information and sharing. it’s really helpfull!
resort (September 26, 2010 at 11:44 am)
It’s so cool thank you. i like it beacause it is so simple!
game (September 28, 2010 at 2:43 am)
Hey John, could you update us with the status of your book?
Motorguide (September 28, 2010 at 10:36 am)
Hey, thanks for that great information.
Inter (September 28, 2010 at 5:04 pm)
Great tool, thank you for sharing.
stainless steel castings (October 1, 2010 at 3:07 am)
Very well build tool. I would be using it anytime soon
Basess Huela (October 1, 2010 at 4:08 am)
Very interesting tool – Thanks for the post
jual kaos (October 1, 2010 at 4:20 am)
Thanks for sharing, and thanks to the team for all the hard work!
Daniel S. (October 1, 2010 at 4:47 am)
Amazing tool. Gotta check some scripts :)
Meridia (October 1, 2010 at 4:57 am)
This tool is amazing. Thanks for sharing
Hardcore Porn Tube (October 1, 2010 at 7:03 am)
Amazing tool, great post
exoticamethyst (October 1, 2010 at 12:47 pm)
Excellent tools..
Great stuff from you, man.
Ben Teller (October 1, 2010 at 5:24 pm)
You got a really useful blog I have been here reading for about an hour. I am a newbie and your success is very much an inspiration for me. Check out this HD Trailer.
Website Submit (October 1, 2010 at 7:08 pm)
This is absolutely exciting. Thanks for sharing, and thanks to the team for all the hard work!
TY THA ARTIST (October 1, 2010 at 9:16 pm)
nice to know… thats why i use firefox!
Godfear Movement (October 1, 2010 at 9:16 pm)
Big brother is watching!!!
Young & Gifted (October 1, 2010 at 9:17 pm)
What about chrome or firefox?
Chase (October 2, 2010 at 3:24 am)
Great to hear they’re working on supporting more browsers, going to give this a try on my site .
MLM Network Marketing Blog (October 2, 2010 at 4:19 am)
That is a shame to let that thing happen again like a dozen years ago. But it seems that it never cease at all and will continue in the future. That is the fact that human is still one kind of animal.
the lemonade diet (October 2, 2010 at 7:40 am)
debugging internet explorer is a brave thing to do. Deep tracing of internet explorer is very interesting. thanks for this aticle
????????????????? (October 2, 2010 at 1:43 pm)
nice to know… thats why i use firefox!
women abs (October 2, 2010 at 1:58 pm)
Yea I love FF
Multi Monitor Mounts (October 2, 2010 at 3:57 pm)
Ajax only works by sticking low-level instrumentation into Internet Explorer when it launches, capturing any activity that occurs – and I mean virtually any activity that you can imagine
Simon (October 2, 2010 at 4:28 pm)
This tool seems very poerful John, than you for your input and effort.
Does it only work with IE though? How about Firefox
Smokes (October 2, 2010 at 5:08 pm)
Nice article and enjoyed reading it. I posted it on my site where you can find the best video game reviews
1stopcontent (October 3, 2010 at 8:13 am)
Hi John, it looks great. How bout testing out with Firefox or Chrome?
J. Orbofu (October 3, 2010 at 11:48 am)
Thanks for calling attention to dynaTrace and some of its diagnostic potential when used with Internet Explorer. Reading over your copy leads me to two questions:
1) While dynaTrace is now set for Internet Explorer will it work, or will there be a version out that does work, with Firefox?
2) Diagnosing how the code runs seems to introduce the logical concern that, knowing what’s going on, is it possible to alter code on our home systems to determine for ourselves what is going to happen.
Hunter Wellingtons (October 4, 2010 at 12:06 am)
but what about FF then IE?
Game (October 4, 2010 at 2:43 am)
Nice analysis tool. Thank you for sharing and ideas for my job.
Spartacus Season 2 (October 4, 2010 at 3:34 pm)
Great stuff – check my site also if you have a minute. Spartacus Season 2
Offshore Hosting (October 4, 2010 at 5:18 pm)
spartacus i checked that
streetwear (October 4, 2010 at 6:10 pm)
good stuff
keyword (October 4, 2010 at 6:30 pm)
Great stuff!
bruno mars (October 4, 2010 at 6:55 pm)
Great stuff!
bruno mars (October 4, 2010 at 7:09 pm)
Great stuff!
wood jesus piece (October 4, 2010 at 7:14 pm)
Great stuff!
iPhone 4 bestellen (October 4, 2010 at 8:09 pm)
nice thanks for this!
Stockdownload (October 5, 2010 at 9:10 am)
Eventhough IE has some cool features I use firefox as it is fast and has support for lot of plugins.
gedichte (October 5, 2010 at 10:12 am)
Great stuff! :)
Flamenco (October 5, 2010 at 5:01 pm)
I’m very, very impressed. Thanks…
Mikal (October 7, 2010 at 9:13 am)
Nice this is great. :–)
schmuu (October 7, 2010 at 10:34 am)
very helpful
Got Junk (October 7, 2010 at 10:46 am)
totally agree with that, i will come back later and follow up on this post
Jonathan (October 7, 2010 at 11:09 am)
Interesting stuff, quite useful. Thanks!
–
Breath-A-Wizer
Marketing Consultant (October 7, 2010 at 11:53 am)
With my clients always wanting to know why things are the way they are in IE, I’m glad there’s a resource like you around. Thanks for this info. I’m looking forward to your book.
lotto (October 7, 2010 at 1:18 pm)
nice blog
Naruto 512 (October 7, 2010 at 1:36 pm)
Great stuff! Thanks for sharing, and thanks to the team for all the hard work!
http://mynarutoblog.com
http://dailyinquirer.myfirstrelease.com
http://fishingfornewbie.com
Mobil Keluarga Ideal Terbaik Indonesia (October 7, 2010 at 4:46 pm)
Come to my site and get free organic traffic dude
cheap flat screen tv (October 7, 2010 at 5:08 pm)
Thanks for sharing this information. Very insightful and helpful to many of us.
Recetas de pollo horneado (October 8, 2010 at 4:26 pm)
la verdad me gusta leer sobre este tipo de cosas, gracias!
Bellevue Plumbing (October 8, 2010 at 7:10 pm)
Whats with the spanish comments?
Hairstyles (October 9, 2010 at 3:22 am)
Really great information, thanks for the heads up about hairstyles :=)
Pvc Makinalar? (October 9, 2010 at 3:22 am)
wow! lucky that i have found this address that gives great data about the pvc makinas?… thanks!
1st Birthday Gifts (October 9, 2010 at 1:23 pm)
That is a shame to let that thing happen again like a dozen years ago. But it seems that it never cease at all and will continue in the future. That is the fact that human is still one kind of animal.
Dan (October 9, 2010 at 10:14 pm)
Nice info!
Watch GLEE Online for FREE!
watchgleeonline.info
Pricheski (October 10, 2010 at 4:11 am)
This tool seems very poerful John, than you for your input and effort.
Does it only work with IE though? How about Firefox
knki (October 10, 2010 at 6:35 am)
very helpful
phuket travel (October 10, 2010 at 11:54 am)
very nice.thanks
Tim Richards (October 11, 2010 at 3:44 am)
Your web site is absolutely full of remarkable info and facts as well as is actually incredibly enjoyable to learn through.Properly performed:)
nigne (October 11, 2010 at 6:38 am)
thanks man
gbbild (October 11, 2010 at 6:39 am)
danke
watchonx (October 11, 2010 at 6:39 am)
thnx sweety
Free Antispyware Downloads (October 11, 2010 at 11:48 am)
Will test the soft. Its a great help in evaluating script performances specially execution time plays an important role in SE aka Google Caffeine.
Thanks.
dubstep (October 13, 2010 at 1:04 pm)
With my clients always wanting to know why things are the way they are in IE, I’m glad there’s a resource like you around. Thanks for this info. I’m looking forward to your book.
snowblower repair (October 14, 2010 at 2:22 am)
This was very helpful to read. Looking forward to future posts on this topic.
authentic nike sneakers (October 15, 2010 at 3:49 am)
his is a nice blog. Good clean UI and nice informative blog. I will be coming back soon, Thanks for posting some great ideas and I’ll try to return back with a completely different browser to check things out
Flamenco (October 15, 2010 at 3:31 pm)
very interesting, I think i will bookmark it.
anime (October 15, 2010 at 9:43 pm)
Yesterday I installed IE 9 and the speed is good but not better than FF.
Y8 (October 16, 2010 at 5:44 am)
nice article mate good point
eken m005 (October 17, 2010 at 10:42 am)
Thanks for information and sharing. it’s really helpfull.
good job
dikeluarin (October 17, 2010 at 10:43 am)
Excellent post… love it
seo weblog (October 18, 2010 at 2:14 am)
good information you have on your blog…keep it up
Singles (October 18, 2010 at 11:16 am)
thanks for sharing..seems very useful.
Sweetsbusiness (October 18, 2010 at 2:16 pm)
Great stuff! Thanks for sharing, and thanks to the team for all the hard work!
houseofshoes (October 18, 2010 at 4:09 pm)
Thanks a lot. Very good stuff! Very interesting.
Aqua Clean (October 19, 2010 at 3:39 am)
Good Stuff, thx a lot for sharing this information, i will bookmark this blog
Dress (October 19, 2010 at 1:26 pm)
Thanks John, it is a tool of analysis that are great. It helps us know that we write good code, or where to improve.
authentic nike sneakers (October 21, 2010 at 2:20 am)
Hello I am so delighted I found your blog, I really found you by mistake, while I was looking on Yahoo for something else, Anyways I am here now and would just like to say thanks for a tremendous post and a all round entertaining blog. Please do keep up the great work
marketing (October 22, 2010 at 8:30 pm)
:-)What youre saying is completely true. I know that everybody must say the same thing, but I just think that you put it in a way that everyone can understand. I also love the images you put in here. They fit so well with what youre trying to say. Im sure youll reach so many people with what youve got to say.
Barry Grant (October 25, 2010 at 5:50 pm)
This is a very good website. I have already been back several times during the last seven days and want to sign up for your rss feed making use of Google but can’t figure out the right way to do it exactly. Would you know of any instructions?
James Dunn (October 25, 2010 at 5:52 pm)
Really god to know – any chance to get information about it in German?
Joe Jimenz (October 27, 2010 at 12:17 am)
Amazing! Exactly what I was looking for! – July 4. Statistics show that we lose more fools on this day than in all the other days of the year put together. This proves, by the number left in stock, that one fourth of July per year is now inadequate, the country has grown so. Mark Twain 1835 1910
Jimmy Jerome (October 27, 2010 at 12:19 am)
I got a bookmark at this article but I do not remember why ?? Was there another article on this domain ? ~supernatural Girl – Give me a couple of years, and I’ll make that actress an overnight success. Samuel Goldwyn 1882 1974
Jason Jeannotte (October 27, 2010 at 12:20 am)
Very useful. I like the way you write. Do you provide an RSS feed? – If I were in this business only for the business, I wouldn’t be in this business. Samuel Goldwyn 1882 1974
Jesse Jessee (October 27, 2010 at 12:20 am)
Your blog is spectacular. I’m really impressed and longing for your next article. Hopefully I will get it soon. Really value this article especially. It’s not easy to separate the good from the bad sometimes, but I think you’ve pushed the right key! Do you accept guest articles here? I would love to post a one or two articles here. – In the first place God made idiots; that was for practice; then he made school boards. Mark Twain 1835 1910
Jason Jordon (October 27, 2010 at 12:22 am)
I could not have said it better myself! – Television has raised writing to a new low. Samuel Goldwyn 1882 1974
Jeffrey Jahde (October 27, 2010 at 12:22 am)
This post has been extremely insightful and useful to increase my knowledge in the field of knowledge and its many facets. Thank you very much, I will certainly come back to visit often and definitely tell some of my internet-inclined friends to visit this site. Keep posting and expressing your knowledge and opinions strong! – Why did you name him Sam? Every Tom, Dick and Harry is named Sam! Samuel Goldwyn 1882 1974