With jQuery 1.3.2 out the door I’ve been looking for more ways to profile and optimize jQuery.
Previously I did a survey of jQuery-using sites to figure out which selectors they were using. This led to the construction of the new Sizzle Selector Engine which targeted those selectors for improvement.
Additionally, I constructed a deep profiling plugin for jQuery which helped to spot methods that were taking a long time to run in live jQuery sites. This helped bring about the improvements in jQuery 1.2.6, 1.3, and 1.3.2.
What do we tackle next? A good place to start would be to tackle optimizing methods that are obviously inefficient – but how do we determine that? One way would be to measure the number of function calls that occur every time a method is run. Firebug provides this information in its profiling data (along with how long it takes to run each method). Unfortunately it’s very clunky to manually type out code, check the results in the console, and determine if they’re bad or if they’ve changed. If only there was a way to progamatically get at those numbers.
FireUnit Profiling Methods
Yesterday I did some work to make getting at the profiling data possible, adding two new methods to FireUnit.
fireunit.getProfile();
Run this method after you’ve run console.profile(); and console.profileEnd(); to get a full dump of the profiling information. For example, given the following profile run:
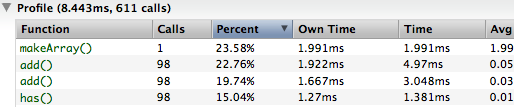
You’ll get the following JavaScript object returned from fireunit.getProfile():
{
  "time": 8.443,
  "calls": 611,
  "data":[
  {
    "name":"makeArray()",
    "calls":1,
    "percent":23.58,
    "ownTime":1.991,
    "time":1.991,
    "avgTime":1.991,
    "minTime":1.991,
    "maxTime":1.991,
    "fileName":"jquery.js (line 2059)"
  },
  // etc.
]}
fireunit.profile( fn );
The second method added to FireUnit provides an easy way to execute and profile a single function. Roughly, this method starts the profiler, executes the function, stops the profiler, and then returns the results from getProfile(). Additionally, it watches for any exceptions that might be thrown and makes sure that the profiler is cleanly turned off anyway (a frequent frustration of mine).
You would use it like this:
fireunit.profile(function(){
  document.getElementsByClassName("foo");
});
How To Use
First, you’ll need to be sure to have the latest copy of FireUnit installed. I’ve built a copy of the latest code, into an extension, if you wish to install it:
When running it you’ll need to make sure that:
- Both the Console and Script tabs are enabled in Firebug
- That the ‘extensions.firebug.throttleMessages’ property in ‘about:config’ is set to ‘false’.
The Results
I put up a test page so that I could quickly run through some jQuery methods to see how they stacked up.
Here are the results of running against jQuery 1.3.2 (“Method” is the jQuery method that was called, with the specified arguments, “Calls” is the number of function calls that occurred when executing the method, “Big-O” is a very rough Big-O Notation for the function calls):
| Method | Calls | Big-O |
|---|---|---|
| .addClass(“test”); | 542 | 6n |
| .addClass(“test”); | 592 | 6n |
| .removeClass(“test”); | 754 | 8n |
| .removeClass(“test”); | 610 | 6n |
| .css(“color”, “red”); | 495 | 5n |
| .css({color: “red”, border: “1px solid red”}); | 887 | 9n |
| .remove(); | 23772 | 2n+n2 |
| .append(“<p>test</p>”); | 307 | 3n |
| .append(“<p>test</p><p>test</p> <p>test</p><p>test</p><p>test</p>”); |
319 | 3n |
| .show(); | 394 | 4n |
| .hide(); | 394 | 4n |
| .html(“<p>test</p>”); | 28759 | 3n+n2 |
| .empty(); | 28452 | 3n+n2 |
| .is(“div”); | 110 | |
| .filter(“div”); | 216 | 2n |
| .find(“div”); | 1564 | 16n |
We can immediately see, by looking at the big-O notation, that most jQuery methods execute at least one function for every element that they have to operate against. addClass runs about 6 functions per element, filter runs about 2, and ‘is’ runs only 1.
We can see the problematic functions sticking out like a massive sore thumb: .remove(), .empty(), and .html() – they all run over n2 function calls, which is a huge issue. (These numbers are all large for a simple reason: .html() uses .empty(), .empty() uses .remove(), and .remove() is obviously inefficient.) While function calls do not, necessarily, indicate slow code (a lot of jQuery’s internal functions are pretty lightweight) it is very likely to indicate inefficiently-written code.
I poked around the code for a little bit and realized that .remove() could be dramatically simplified. I filed a ticket and landed a patch which resulted in these much-improved numbers:
| Method | Calls | Big-O |
|---|---|---|
| .remove(); | 298 | 3n |
| .html(“<p>test</p>”); | 507 | 5n |
| .empty(); | 200 | 2n |
I’m really excited by this new tool. Automating the process of code profiling opens up whole avenues of exploration. Even using nothing more than the above tool I can immediately see room for improving just about every jQuery method.
It’s also be very interesting to have this running in some sort of continuous integration setting, to catch any egregious regressions – but I’ll leave that for another day.


Adam (February 23, 2009 at 1:02 pm)
Thanks for this! I’m working on a JS game engine of sorts, and one of the next things I needed to setup was a way to profile things with one easy line of code.
Tim (February 23, 2009 at 1:27 pm)
Awesome stuff. I really must give FireUnit a go
Ben (February 23, 2009 at 1:30 pm)
Fascinating analysis! Profiling single functions with
fireunit.profilewill be a major convenience.May I suggest you remove the “very rough” Big-O notation? Those expressions in n are useful for sure, but they aren’t really valid in the asymptotic sense: all the multiples of n are still just linear, and expressions like 2n+n^2 collapse to n^2. I’m sure you know this, and I don’t blame you at all for abusing the notation. I’m just suggesting that you’d be better off keeping the expressions as they are and dropping the Os.
Ioseb (February 23, 2009 at 1:35 pm)
Absolutely fantastic John! I’ve just tried those new profiling functions and they are awesome!
Iair Salem (February 23, 2009 at 1:36 pm)
Despite the profiler which is great, you managed to optimize a big bottle-neck (.remove()), so good for you and for everyone! Hope to see it in the next jQuery version!
Iair.
Blaise Kal (February 23, 2009 at 1:41 pm)
I’m sure it’s worth it (because you’re a god!), but don’t these kind of optimizations make the code harder to maintain?
John Resig (February 23, 2009 at 1:47 pm)
@Ben: Yeah, that’s true – I just removed the O(…) bit since it’s really only in the style of big-O notation.
@Blaise: In some cases they might – but we would certainly want to avoid that. If there’s one thing that the jQuery code base is good at it’s code reuse. Unfortunately that comes at a cost, so we’ll need to decide if and when to use the best techniques for optimization vs. simplicity.
Nosredna (February 23, 2009 at 1:56 pm)
Will the mentioned speedup be part of 1.3.3?
John Resig (February 23, 2009 at 1:57 pm)
@Nosredna: Yes.
Nosredna (February 23, 2009 at 2:02 pm)
On the issue of “Big O.” IIRC (and it’s been 20+ years for me) these are all just O(N) or O(N^2). As Ben notes, it’s the asymptote that counts.
John Resig (February 23, 2009 at 2:16 pm)
@Nosredna: Right, but in this case the number before actually matters for doing optimization – rounding it off and only giving the asymptote greatly diminishes the usefulness of the analysis. There’s a huge difference between 16n and 2n and it’s important to point that out.
Nosredna (February 23, 2009 at 3:06 pm)
Oh yeah, not disagreeing there. Go after the biggest sore thumbs first. Great job!
Ben (February 23, 2009 at 3:11 pm)
Another, more substantive, thought: have you thought about letting
fireunit.profileaccept an optional second parameter to specify a number of times to call the function? Not sure if the results should reflect the average or the total number of functions called, in that case. (On the other hand, it would be trivial to write a wrapper function that calls the target function repeatedly.)John Resig (February 23, 2009 at 3:25 pm)
@Ben: I’m hesitant to do that because it’ll end up increasing the total number of function calls (whereas the profiler seems to be pretty accurate even with a single call). At least for now I think I’d recommend just doing a loop inside the function if you wish to increase repetition.
Nate Cavanaugh (February 23, 2009 at 4:04 pm)
Awesome to see you tackling the performance aspect of jQuery’s internals.
May I suggest taking a look at removing .each everywhere you can internally? I know there are times when you need the closure or the ambiguous object to loop through, but most of the cases I’ve found in there seem a bit gratuitous, and the extra costs add up quite quickly compared to native loops.
Sebastian Werner (February 23, 2009 at 4:13 pm)
John, I get some crazy errors when try to use the tool:
fireunit.profile(function(){ document.getElementsByClassName(“foo”); });
Es gibt keine Aktivität, die gemessen werden könnte.
[Exception… “Index or size is negative or greater than the allowed amount” code: “1” nsresult: “0x80530001 (NS_ERROR_DOM_INDEX_SIZE_ERR)” location: “chrome://fireunit/content/fireunit.js Line: 388”]
Any idea what’s going wrong?
I am using Firefox 3.0.6 with Firebug 1.3X.3b4
Thanks!
John Resig (February 23, 2009 at 4:18 pm)
@Sebastian Werner: You probably need to turn on both the console and the script tab. My guess is that the script tab is currently turned off (and, thus, the profiler is turned off as well).
Sebastian Werner (February 23, 2009 at 4:20 pm)
@John: You are right, seems that I have overlooked this setting. Thanks.
Sebastian Werner (February 23, 2009 at 4:26 pm)
OK, still do not work because of my German Firefox I think :)
I get a “time is null” at line 393 because the regular expression used previously is not compatible when dealing with a German version where “calls” reads “Aufrufe”.
.match(/([\d.]+)ms, (\d+) call/);
Do you plan to make it ready for such international usage? Will go back to an English version for now. :)
Josh Powell (February 23, 2009 at 4:32 pm)
Does the Big-O notation show up in firebug? I don’t see it.
John Resig (February 23, 2009 at 4:47 pm)
@Sebastian: I’m honestly not sure – I guess at some point I can look in to it (tweak the RegExp).
@Josh Powell: No, that’s on the test page that I created and linked to (since it only correlates with jQuery methods).
Josh Powell (February 23, 2009 at 4:55 pm)
Ah, I was hoping it was in firebug so I could see the big O on my projects easily. Very nice work though, I’m thoroughly impresses with the emphasis on speed for the entire library for the 1.3.1+ releases. Faster, faster, faster!
Daniel Friesen (February 23, 2009 at 6:28 pm)
John, is all that “// Prevent memory leaks” code is IE oriented?
It would be interesting to see a benchmark on speed comparison between jQuery and jQuery without all the extra stuff done to avoid memory leaks.
Dannii (February 23, 2009 at 7:25 pm)
I had just been profiling my code and found that .remove() .empty() and .html() were running far more than I liked. Thanks for fixing this!
Fillano Feng (February 23, 2009 at 9:51 pm)
Wow, my problem is the same as Sebastian Werner while using Chinese verison of Firefox. The “ms” and “call” have been translated into Chinese in my firebug console, so the RE in fireunit.js line 391 doesn’t work properly and raises an error in line 393.
John Resig (February 23, 2009 at 11:51 pm)
@Sebastian and Fillano: I’ve fixed all of the issues that were previously mentioned and uploaded a new copy of the extension. Feel free to give it a try, again.
TweeZz (February 24, 2009 at 12:52 am)
Do you ever sleep? :)
michael (February 24, 2009 at 3:22 am)
Does not work for me:
linenumber 93
message “fireunit.getProfile is not a function”
name “TypeError”
source “with (_FirebugCommandLine) {\n fireunit.getProfile() \n};”
I am using FF 3.0.6, script and console-tab is on in firebug.
Andrea Giammarchi (February 24, 2009 at 4:54 am)
Really Interesting John.
I wonder how could perform then a cleanData like this:
var cleanData = (function(cache){

    return function(elems){

        for(var i = elems.length; i--; delete cache[elems[i][expando]]);

    }

})(jQuery.cache);
Andrea Giammarchi (February 24, 2009 at 4:58 am)
… or this ..
for(var id, i = elems.length; i; (id = elems[--i][expando]) && delete cache[id]);Ok, I have to try fireunit :D
Edwin Khodabakchian (February 24, 2009 at 5:20 am)
Hi John,
This is great work. It correlates with one of the issues we have been running into when using jquery: the remove operation is *very* expensive but really necessary when unbinding event handlers to try to avoid memory leaks. This was all the more problematic that JQuery seems to include some sort of cache which keeps a reference to the DOM elements. For large JS applications, it would be great if JQuery could evolve to allow support for more fine grain support for DOM binding and better control over the cache otherwise, it becomes very difficult for the application to proactively and aggressively break DOM/JS references and help garbage collector (at least that has been our experience).
Andrea Giammarchi (February 24, 2009 at 5:29 am)
John, I have tested the first suggestion and I obtain 6 as result.
var cleanData = (function(cache){return function(elems){
for(var i=elems.length; i; delete cache[elems[--i][expando]]);
}})(jQuery.cache);
It is quite weird because in the profiler table things are a bit different:
remove() 98 51.32% 2.512ms 4.392ms 0.045ms 0.035ms 0.078msbut the same remove is not present in every table. How should I read such result then? Thank you for the extension, it works perfectly and I guess it’s a must for performances optimizations.
Regards
Dirceu Pauka Jr. (February 24, 2009 at 9:33 am)
Thanks John. I’m “working” on a JS video decoder and things have to be optmizated here.
John Resig (February 24, 2009 at 10:35 am)
@michael: That’s because you’re using an old version of FireUnit – you have to use the one that I link to above.
@Edwin: Glad to hear this helped – we already provide pretty fine-grained
@Andrea: I guess I could just try and delete it blindly like you’re doing, dunno. How much of a speed increase are you seeing (especially in IE)?
Jeffrey Gilbert (February 24, 2009 at 11:42 am)
You’re the Tony Hawk of Javascript… Every time I think things can’t possibly get faster, BAM! 720.
Andrea Giammarchi (February 24, 2009 at 11:56 am)
John, my last example switches from 280 to 6 … but I am not sure I am reading properly the result:
var cleanData = (function(cache){

return function(elems){

    for(var i=elems.length; i; delete cache[elems[--i][expando]]);

}})(jQuery.cache);
Ben (February 24, 2009 at 4:32 pm)
comp.lang.javascript can suck it.
Keep up the good work, John.
Jason Kuhn (February 24, 2009 at 4:55 pm)
@john did you know this was available in safari 4beta? i was just going through it and noticed they also have a profiling feature (and a bunch of other dev tools!).
i wonder how well the current versions of the various frameworks do in slickspeed…
Andrea Giammarchi (February 25, 2009 at 5:31 am)
John, I can confirm my code with direct delete is up to 2 times faster in every browser IE included.
In few words you do not need the if because if with an implicit cast plus hash search in the object is slower than a possibly missed delete over the same object.
(I tried to post the little test I did but for some reason it disappeared …)
Andrea Giammarchi (February 25, 2009 at 5:32 am)
var o = {}, a = new Array(100000).join("-.-").split(".");for(var id, i = a.length, t1 = new Date; i; (id = a[--i]) && delete o[id]);
t1 = new Date - t1;
for(var i = a.length, t2 = new Date; i; delete o[a[--i]]);
t2 = new Date - t2;
alert([
"in for with check: " + t1,
"in for direct delete: " + t2
].join("\n"));
Edwin Khodabakchian (February 25, 2009 at 7:26 pm)
John,
Regarding local unbinding, imaging that you have a DOM subtree into which you have injected click handlers using jquery. How would you go about unbinding the event handlers from the DOM elements without doing a massive delete?
Thank you,
Edwin
John Resig (February 25, 2009 at 8:03 pm)
@Edwin, I’d imagine something like this: $(“#myelem *”).unbind();
Crescent Fresh (February 27, 2009 at 11:53 pm)
Wait, so does your rewrite of remove() still unbind events like 1.3.2 does/did? Does “delete jQuery.cache[ id ]” do this?
uzicoppa (March 2, 2009 at 1:24 pm)
i got the extension Fireunit to test your code, but when i wanted to try your example, firebug just throw me this error:
“fireunit.profile is not a function” (just like michael michael a bit higher)
Jason D (March 14, 2009 at 4:27 pm)
Thank you all for your work and dedication.
przeprowadzki (April 23, 2009 at 3:05 am)
var cleanData = (function(cache){
return function(elems){
for(var i = elems.length; i–; delete cache[elems[i][expando]]);
}
})(jQuery.cache);
This isnt work on my system… :/